

What we have delivered, and how to read it.
Our track record across all client portfolios since 2018, the broad whisky market alongside it, and the return we tell investors to expect.
Our track record
Measured across all client portfolios, from the launch of Asset Management in 2018.
average return per year
Average IRR across all 947 client portfolios, including payouts and unweighted, from 2018 through 2025.

average value growth per year
The Scotland index: auction prices of the 500 most traded Scotch bottles over the same period, +2.6% in total. There is no public index for casks.

expected net return per year
Depending on the amount invested, the risk profile, the holding period and market developments.
Past performance is not a guarantee of future results. Value can fall as well as rise, and figures are estimates until a sale completes.

The Whiskystats Scotland index since 2012
This index tracks the auction prices of the 500 most traded Scotch bottles, mostly official bottlings. It is the broad bottle market: casks are not in it, and neither is a targeted selection of bottles. The line shows the market, not our returns.
- Starting point, December 2012
- 100
- Peak, April 2022
- 352
- Broad market since the launch of Asset Management (January 2018 to December 2025)
- +2.6%
Source: Whiskystats, Scotland index, December 2012 = 100, monthly values. Move along the line for the value per month. Our 9.6% a year is the average IRR across all 947 client portfolios, including payouts, unweighted, from January 2018 through December 2025.
| Month | Index |
|---|---|
| December 2012 | 100.0 |
| January 2013 | 110.6 |
| February 2013 | 101.4 |
| March 2013 | 101.4 |
| April 2013 | 105.0 |
| May 2013 | 108.4 |
| June 2013 | 105.1 |
| July 2013 | 99.6 |
| August 2013 | 104.2 |
| September 2013 | 114.8 |
| October 2013 | 112.3 |
| November 2013 | 110.6 |
| December 2013 | 115.0 |
| January 2014 | 124.2 |
| February 2014 | 134.1 |
| March 2014 | 127.5 |
| April 2014 | 118.8 |
| May 2014 | 127.2 |
| June 2014 | 135.3 |
| July 2014 | 139.1 |
| August 2014 | 143.6 |
| September 2014 | 142.7 |
| October 2014 | 143.7 |
| November 2014 | 135.8 |
| December 2014 | 144.7 |
| January 2015 | 132.0 |
| February 2015 | 147.9 |
| March 2015 | 143.8 |
| April 2015 | 149.2 |
| May 2015 | 151.5 |
| June 2015 | 155.1 |
| July 2015 | 153.6 |
| August 2015 | 162.4 |
| September 2015 | 155.9 |
| October 2015 | 155.8 |
| November 2015 | 163.8 |
| December 2015 | 159.4 |
| January 2016 | 158.2 |
| February 2016 | 153.8 |
| March 2016 | 162.7 |
| April 2016 | 163.0 |
| May 2016 | 165.4 |
| June 2016 | 172.0 |
| July 2016 | 168.5 |
| August 2016 | 177.5 |
| September 2016 | 182.0 |
| October 2016 | 167.7 |
| November 2016 | 163.5 |
| December 2016 | 180.2 |
| January 2017 | 178.5 |
| February 2017 | 182.4 |
| March 2017 | 189.0 |
| April 2017 | 181.7 |
| May 2017 | 196.1 |
| June 2017 | 192.2 |
| July 2017 | 198.1 |
| August 2017 | 180.6 |
| September 2017 | 182.0 |
| October 2017 | 181.6 |
| November 2017 | 191.0 |
| December 2017 | 199.2 |
| January 2018 | 194.4 |
| February 2018 | 199.7 |
| March 2018 | 204.1 |
| April 2018 | 197.9 |
| May 2018 | 197.9 |
| June 2018 | 204.7 |
| July 2018 | 215.2 |
| August 2018 | 213.1 |
| September 2018 | 216.3 |
| October 2018 | 212.9 |
| November 2018 | 210.6 |
| December 2018 | 202.1 |
| January 2019 | 198.7 |
| February 2019 | 205.8 |
| March 2019 | 213.7 |
| April 2019 | 212.1 |
| May 2019 | 224.2 |
| June 2019 | 212.8 |
| July 2019 | 220.8 |
| August 2019 | 209.0 |
| September 2019 | 203.2 |
| October 2019 | 198.5 |
| November 2019 | 189.4 |
| December 2019 | 184.8 |
| January 2020 | 192.8 |
| February 2020 | 205.9 |
| March 2020 | 198.3 |
| April 2020 | 196.6 |
| May 2020 | 206.0 |
| June 2020 | 211.8 |
| July 2020 | 227.0 |
| August 2020 | 227.9 |
| September 2020 | 221.3 |
| October 2020 | 224.2 |
| November 2020 | 225.5 |
| December 2020 | 228.7 |
| January 2021 | 238.0 |
| February 2021 | 261.1 |
| March 2021 | 265.6 |
| April 2021 | 262.2 |
| May 2021 | 270.6 |
| June 2021 | 253.7 |
| July 2021 | 280.5 |
| August 2021 | 286.7 |
| September 2021 | 281.3 |
| October 2021 | 295.0 |
| November 2021 | 311.8 |
| December 2021 | 299.0 |
| January 2022 | 312.4 |
| February 2022 | 323.5 |
| March 2022 | 344.6 |
| April 2022 | 352.4 |
| May 2022 | 334.0 |
| June 2022 | 326.0 |
| July 2022 | 342.3 |
| August 2022 | 334.9 |
| September 2022 | 327.3 |
| October 2022 | 325.8 |
| November 2022 | 317.5 |
| December 2022 | 285.1 |
| January 2023 | 283.7 |
| February 2023 | 298.2 |
| March 2023 | 288.5 |
| April 2023 | 279.8 |
| May 2023 | 269.2 |
| June 2023 | 269.4 |
| July 2023 | 271.1 |
| August 2023 | 256.9 |
| September 2023 | 255.0 |
| October 2023 | 248.2 |
| November 2023 | 231.5 |
| December 2023 | 230.9 |
| January 2024 | 233.2 |
| February 2024 | 236.7 |
| March 2024 | 236.6 |
| April 2024 | 230.8 |
| May 2024 | 227.2 |
| June 2024 | 226.1 |
| July 2024 | 233.5 |
| August 2024 | 238.2 |
| September 2024 | 240.9 |
| October 2024 | 228.8 |
| November 2024 | 223.7 |
| December 2024 | 215.5 |
| January 2025 | 218.0 |
| February 2025 | 217.7 |
| March 2025 | 217.9 |
| April 2025 | 205.0 |
| May 2025 | 208.2 |
| June 2025 | 206.9 |
| July 2025 | 210.8 |
| August 2025 | 212.9 |
| September 2025 | 208.3 |
| October 2025 | 206.3 |
| November 2025 | 204.5 |
| December 2025 | 199.4 |
| January 2026 | 204.4 |
| February 2026 | 201.9 |
| March 2026 | 207.3 |
| April 2026 | 196.6 |
| May 2026 | 198.8 |
| June 2026 | 205.4 |
| July 2026 | 205.1 |
| August 2026 | 210.5 |
| September 2026 | 209.8 |

Selection is what decides
Our portfolios hold casks and bottles. Both move differently from the auction-market average. What drives the value of each is set out on the casks and rare bottles pages.
Value that grows with time
- Time in woodA cask grows older and scarcer every year. That value builds independently of the mood at auction.
- No auction indexCasks are not traded at auction and so are not in the Scotland index.
- Entry and managementThe price paid on day one and the Cask Management during maturation.
A selection, not the market
- Targeted choiceWe do not buy a cross-section of the 500 most traded bottles; we choose specific ones.
- ScarcityClosed distilleries and limited releases, whose supply can only shrink.
- Condition and provenanceSeal, fill level and documentation help decide what a bottle fetches.

The broad market rose and fell back. Selection made the difference.
Read return language carefully
We deliberately separate four very different things, and we never blur them.
Historical performance
What happened in the past.
Target expectations
Objectives, not commitments.
Hypothetical scenarios
Illustrations, not forecasts.
Actual realised results
Only after an asset is sold.
No guaranteed returns. Nothing here is a promise of performance. Scotch whisky is a long-term alternative investment. Value can fall as well as rise, these assets can be illiquid, and past performance is not a guarantee of future results. This is general information, not financial advice.
Values are estimates until an actual sale completes. Illustrations do not represent the experience of any individual investor.
Continue with whisky investing
From the assets themselves to how it works and what the risks are.

Risks
Illiquidity, valuation, storage and market risk, set out in plain terms.
→
Why Scotch Whisky
Scotch whisky combines production constraints, long maturation and durable global demand: the traits investors look for in a physical asset.
→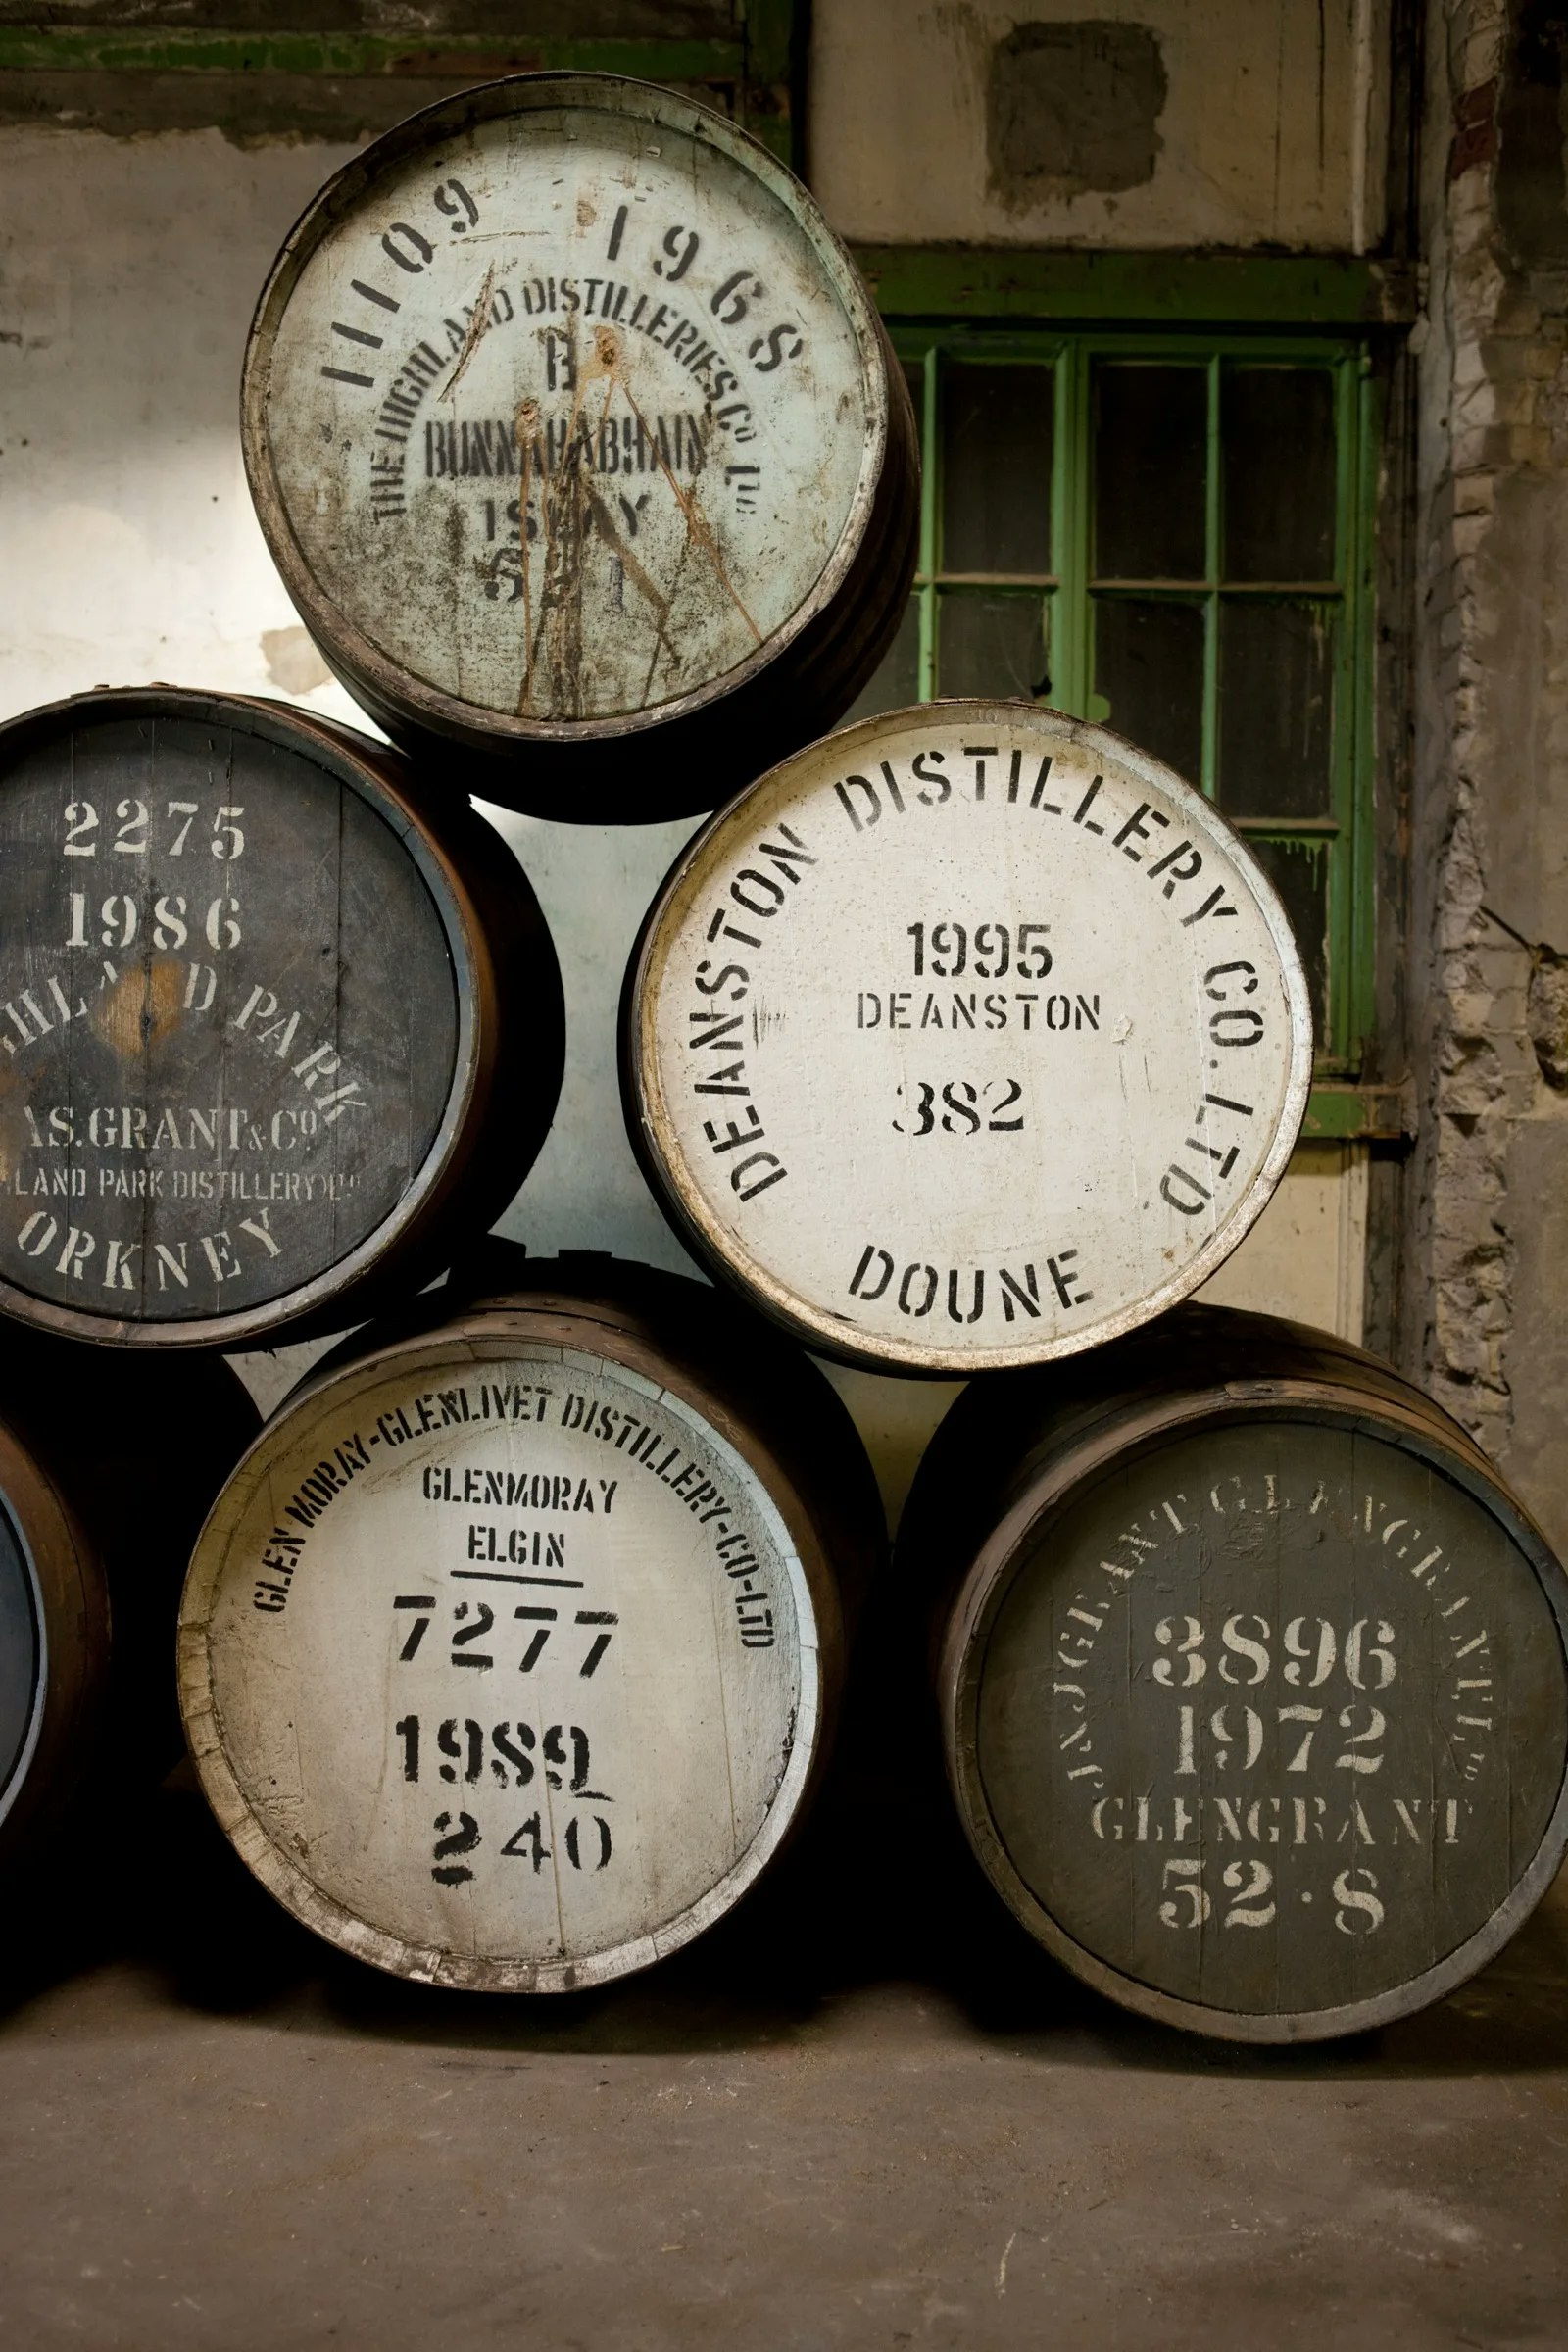
Whisky Casks
A living asset that develops in the wood, with maturation as part of the return.
→
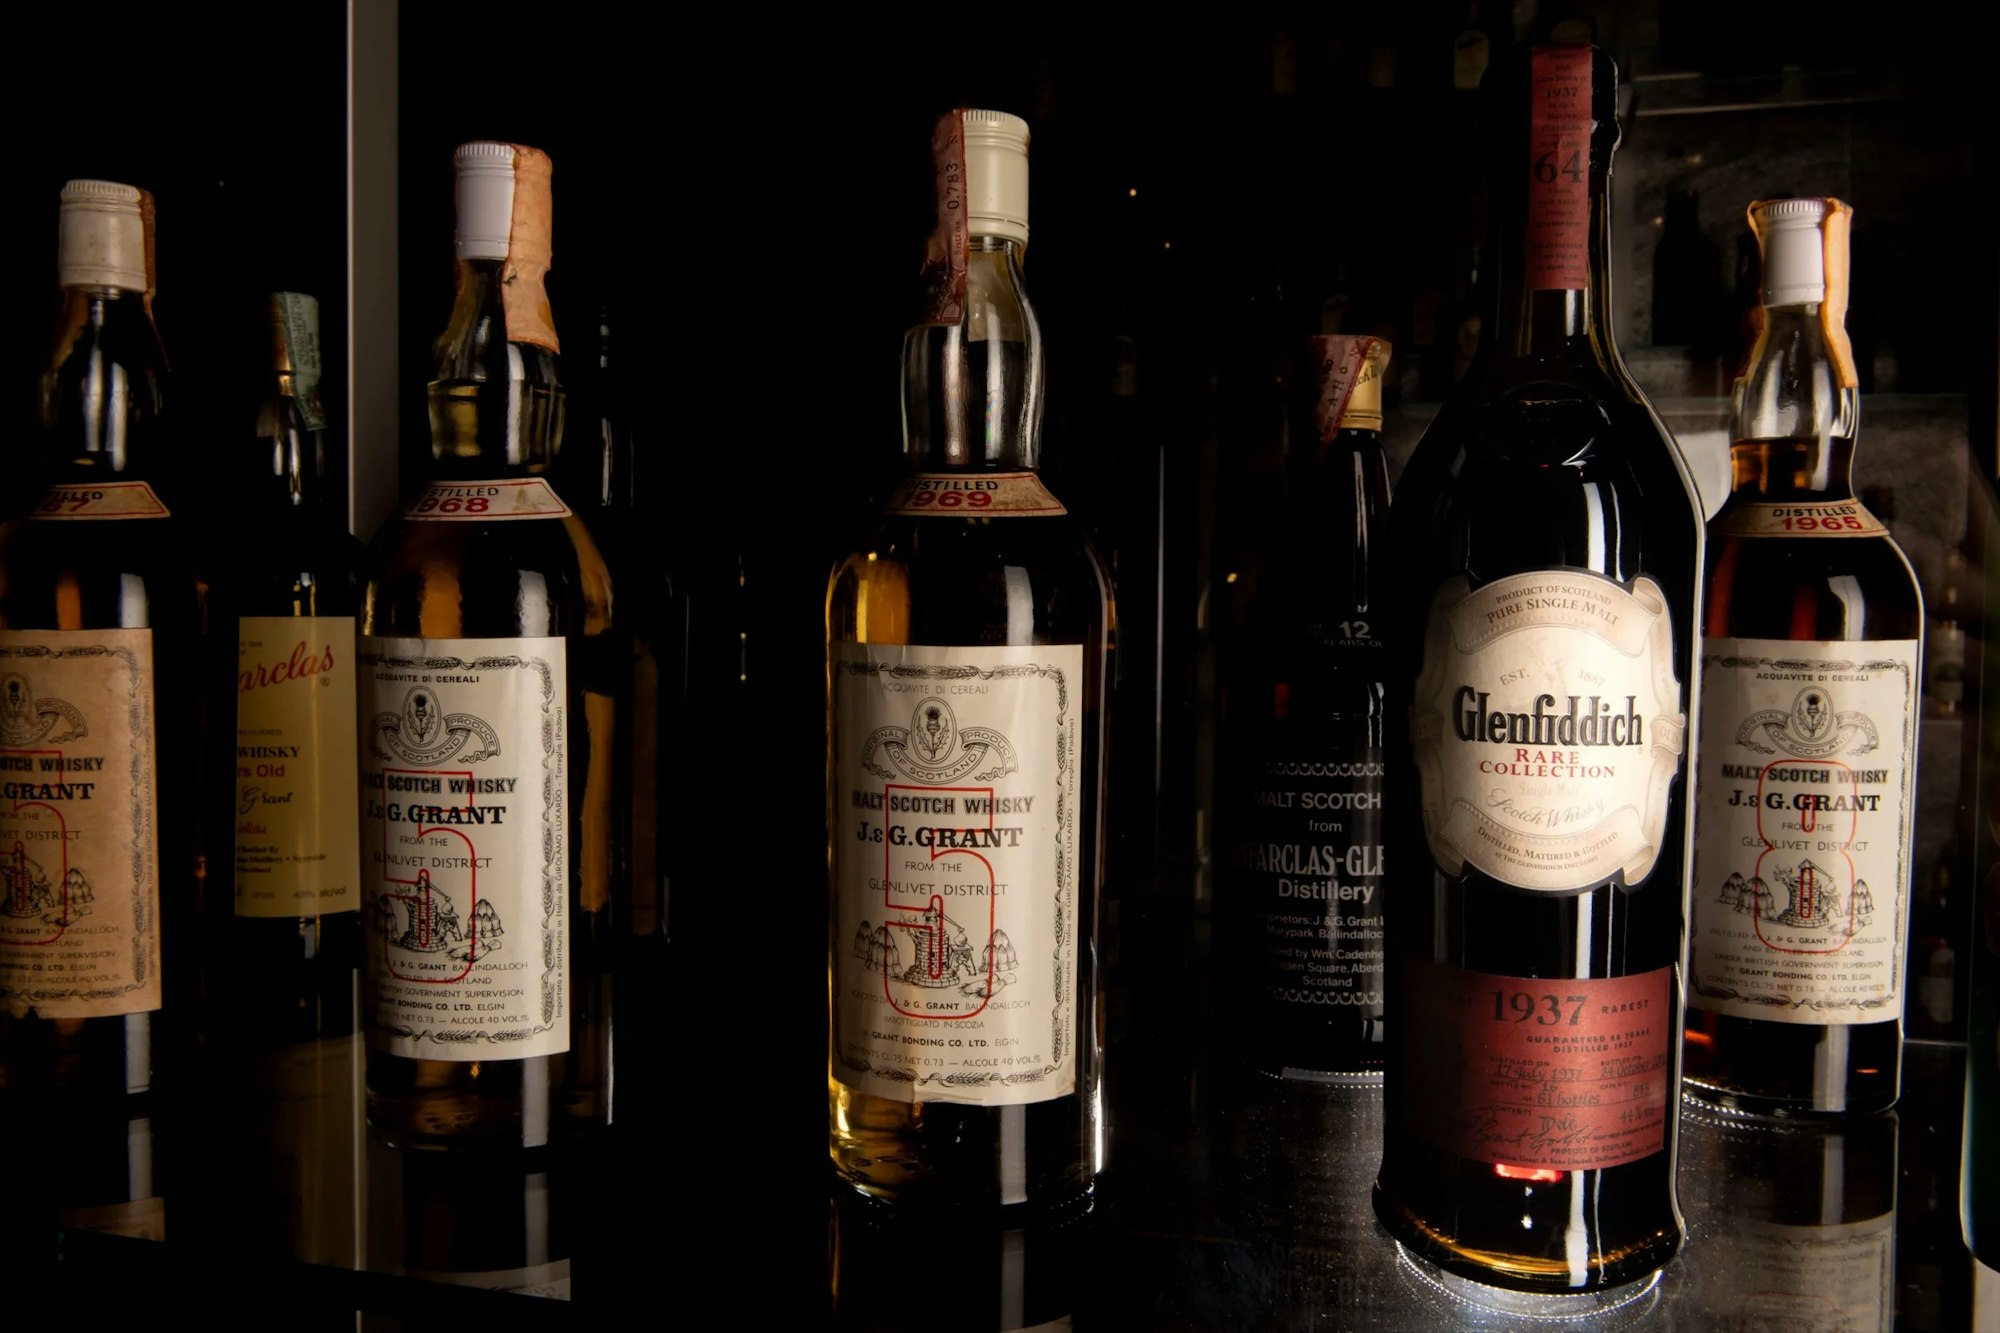
Rare & Collectible Bottles
A finished product, valued on brand, rarity and demand in the auction market.
→
Portfolio Diversification
Why casks and bottles behave differently, and what that does for a portfolio.
→
How It Works
From first conversation to eventual exit, step by step.
→
Want to know what this means for your assets?
Speak with Boris Postma about value development, costs and risks. Past performance is no guarantee of future results.